GSLIB Help Page: BIVPLT

 Description:
-
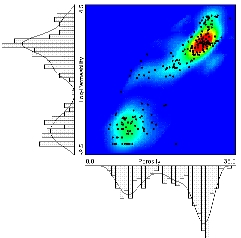
The histsmth and scatsmth programs smooth univariate
and bivariate distributions. The bivplt program documented
here displays the results. The plot also shows the original data pairs
and the original unsmoothed data histogram.
 Parameters:
-
datafl: The data file with the paired data in a simplified
Geo-EAS format.
-
icolx, icoly, and icolwt: The columns for the x
variable (horizontal axis), y variable (vertical axis), and
weight (if less than or equal to zero then equal weighting is used;
otherwise, the weight is used to calculate the summary statistics).
-
ilogx and ilogy: set to 1 if log scaling has been used
for the x or y axis respectively.
-
tmin and tmax: all values strictly less than tmin
and strictly greater than tmax are ignored.
-
smoothx: the data file with the smoothed x distribution.
-
icolvr and icolwt: the column location for the variable
and the weight (probability).
-
smoothy: the data file with the smoothed y distribution.
-
icolvr and icolwt: the column location for the variable
and the weight (probability).
-
smoothxy: the data file with the smoothed bivariate distribution.
-
icolx, icoly and icolwt: the column locations for the
x and y variables and the weight (probability).
-
outfl: file for PostScript output.
-
imap and icolor: specify whether a pixel map of the
bivariate probabilities will be created (imap1 will create one)
and whether it will be color (icolor1) or gray scale (
icolor=0).
-
pmin, pmax and pinc: minimum and maximum plotting limits
for the pixel map.
-
title: a 40-character title for the top of the plot.

