GSLIB Help Page: HISTPLT

 Description:
-
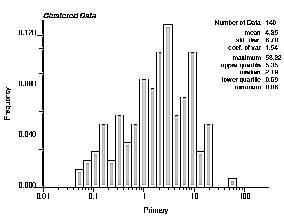
histplt has been custom written to generate some univariate
statistical summaries and a visual output that is compatible with a
PostScript display device. The input data is a variable from a
simplified Geo-EAS input file where the variable in another column can
act as a weight (declustering weight, specific gravity, thickness for
2-D data,...). These weights do not need to add up to one. Minimum
and maximum trimming limits can be set to remove missing values and
outliers. The program will automatically scale the histogram. The
user can choose to set the minimum and maximum histogram limits,
number of classes, and whether or not to use a logarithmic scale.
 Parameters:
-
datafl: the data file in a simplified Geo-EAS format.
-
ivr and iwt: column number for the variable and the
weight. If iwt less than or equal to 0, equal weighting is
considered.
-
tmin and tmax: all values strictly less than tmin
and strictly greater than tmax are ignored.
-
outfl: file for PostScript output.
-
hmin and hmax: minimum and maximum plotting limits for the
variable axis (abscissa). These do not have to be compatible with
tmin and tmax Values that are less than hmin or
greater than hmax will appear just beyond either end of the
histogram plot. They contribute to the statistics calculated.
Setting hmin greater than hmax will cause the program to
set the limits to the minimum and maximum data values encountered.
-
fmax: maximum frequency value for plotting vertical axis.
The maximum will be determined automatically if fmax is set less
than 0.0. This option is used to force the same histogram axis
for different sets of data.
-
ncl: the number of classes.
-
ilog: =0 then an arithmetic scaling of the variable scale
is used, =1 then a logarithmic scaling (base 10) is used.
-
icum: =0 then a frequency histogram will be constructed, =1 then
a cumulative histogram will be constructed.
-
ncum: the number of quantiles to plot when constructing a
cumulative histogram
-
ndec: the number of decimal places to use for the statistics
annotated on the histogram plot (if set to 0, then the number will be
automatically determined).
-
title: a 40-character title for the top of the plot.
-
pos: positioning of statistics. At times it is desirable to move
the statistics from right to left to avoid overwriting the histogram
bars (pos=1 is the left and pos=1 is the right).
-
refval: reference value for a box plot under the histogram. If
this value is within the allowable range specified by tmin and
tmax then a label on the horizontal X axis will not be
plotted and, instead, a box plot will be shown (outside whiskers at
the 95% probability interval, inside box at the 50% probability
interval, vertical solid line at the median, and black dot at the
reference value specified by refval)

