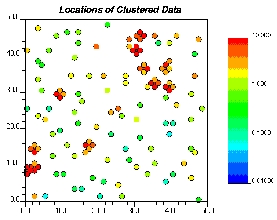
GSLIB Help Page: LOCMAP

 Description:
-
For reporting small 2-D data sets it is often convenient to plot a
location map where the magnitude of the data values are expressed
with a gray or color scale.
 Parameters:
-
datafl: the data file in a simplified Geo-EAS format.
-
icolx, icoly, and icolvr: The columns for the x
variable (horizontal axis), y variable (vertical axis), and
the variable (for coding the color / gray scale of the symbol).
-
tmin and tmax: all values strictly less than tmin
and strictly greater than tmax are ignored.
-
outfl: file for PostScript output.
-
xmn and xmx: the limits in the x direction,
-
ymn and ymx: the limits in the y direction,
-
idata: when data values are being posted (idata=0) then a
circular symbol is used; when the results of cross validation are being
posted (idata=1) then plus or minus signs are posted and filled
in by the absolute magnitude of the error value.
-
ilog: =0 then an arithmetic scaling of the gray/color scale
is used, =1 then a logarithmic scaling (base 10) is used.
-
igray: =0 then a gray scale is used, =1 then a color scale
is used.
-
ilabel: =0 then no labels will be displayed, =1 then each
location will be annotated with the attribute value
-
gmin, gmax and ginc: minimum and maximum limits for the
variable axis (gray or color scale plotting) and increment for labeling
a legend bar. These do not have to be compatible with tmin and
tmax Values that are less than gmin or greater than
gmax will appear just beyond either end of the gray/color
spectrum.
-
labsiz: size of the labels (0.1 is for small labels, 1 is the
default size, and 10 is for large labels)
-
title: a 40-character title for the top of the plot.
A short description of the program

