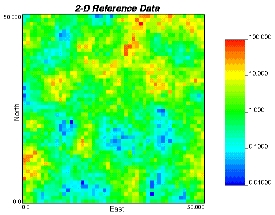
GSLIB Help Page: PIXELPLT

 Description:
-
For plotting 2-D slices through gridded 3-D data sets, e.g., as
generated by kriging or simulation algorithms, one can use gray or
color scale maps.
 Parameters:
-
datafl: The data file containing the 2-D/3-D grids with x
cycling fastest, then y then z then per simulation.
-
icol: column number in the input file to consider. This is
typically one (1).
-
tmin and tmax: all values strictly less than tmin
and strictly greater than tmax are ignored.
-
outfl: file for PostScript output.
-
ireal: the grid or realization number to consider.
-
nx, xmn, and xsiz: the number of nodes in the x
direction, the origin, and the grid node separation.
-
ny, ymn, and ysiz: the number of nodes in the y
direction, the origin, and the grid node separation.
-
nz, zmn, and zsiz: the number of nodes in the z
direction, the origin, and the grid node separation.
-
slice: the type of slice through the 3-D grid to consider
(1=horizontal XY slice, 2=vertical XZ slice, 3=vertical YZ slice). The
axes increase to the right and to the top.
-
sliceno: the slice number to consider (if slice=1 then
sliceno must be between 1 to nz, if slice=2 then
sliceno must be between 1 to ny, if slice=3 then
sliceno must be between 1 to nx.
-
title: a 40-character title for the top of the plot.
-
xlab: a 40-character label that will appear centered below the
plot.
-
ylab: a 40-character label that will appear vertically centered
to the left of the plot.
-
ilog: =0 then an arithmetic scaling of the gray/color scale
is used, =1 then a logarithmic scaling (base 10) is used.
-
igray: =0 then a gray scale is used, =1 then a color scale
is used.
-
icont: =0 for a continuous variable, =1 for a categorical
variable.
-
gmin, gmax, and ginc: minimum, maximum, and labeling
increment for a continuous variable. These do not have to be compatible
with tmin and tmax Values that are less than gmin
or greater than gmax will appear just beyond either end of the
gray/color spectrum.
-
ncat: number of categories
for each category:
-
code, colorcode, and name: the integer code of the
category, the color code to plot the category, and a name to put beside
the color on the legend. The color codes have been chosen arbitrarily
as follows: 1=red, 2=orange, 3=yellow, 4=light green, 5=green,
6=light blue, 7=dark blue, 8=violet, 9=white, 10=black, 11=purple,
12=brown, 13=pink, 14=intermediate green, and 15=gray.
