GSLIB Help Page: SCATPLT

 Description:
-
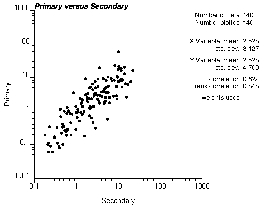
scatplt displays bivariate scatterplots and some statistical
summaries for PostScript display. The summary statistics
are weighted, except for the rank order (Spearman) correlation
coefficient.
 Parameters:
-
datafl: The data file in a simplified Geo-EAS format.
-
icolx, icoly, icolwt and icol3vr: The columns for the
x variable (horizontal axis), y variable (vertical
axis), weight (if less than or equal to zero then equal weighting
is used; otherwise, the weight is used to calculate the summary
statistics), and third variable (if less than or equal to zero then
no third variable is considered; otherwise, each bullet is gray
scale coded according to this third variable)
-
tmin and tmax: all values strictly less than tmin
and strictly greater than tmax are ignored.
-
outfl: file for PostScript output.
-
xmin, xmax and xlog: minimum and maximum plotting limits
for the x axis. These do not have to be compatible with the
trimming limits. Pairs within the trimming limits, but outside the
plotting limits, are still used for computing the correlation
coefficient. Setting xmin greater than or equal to
xmax will cause the
program to use the minimum and maximum data values encountered.
If xlog=0 then an arithmetic scaling of the x axis
is used, xlog=1 then a logarithmic scaling is used.
-
ymin, ymax and ylog: minimum and maximum plotting limits
for the y axis. Setting ymin greater than or
equal to ymax will cause
the program to use the minimum and maximum data values encountered.
If ylog=0 then an arithmetic scaling of the y axis will
be used, ylog=1 then a logarithmic scaling will be used.
-
nthpoint: plot every nthpoint'th data point. This should
normally be set to 1, however, it may be used to subset large data
sets.
-
dotsiz: size of the black dot marking each data (0.1 is small,
1.0 is the default, and 10 is big)
-
gmin and gmax: minimum and maximum gray scale limits: used
if a third variable is considered to shade each data point
-
title: a 40-character title for the top of the plot.
A short description of the program
 Application notes:
-
If the scatterplot appears too erratic because of too few data, one
may consider smoothing.
-
The plot may become quite crowded if there are too many data pairs.

